Jun 28, 2010
Amazongate: the missing evidence
By Christopher Booker
Last week the beleaguered global warming lobby was exulting over what it took to be the best news it has had in a long time. A serious allegation, which last January rocked the authority of the UN’s Intergovernmental Panel on Climate Change, was “corrected” as untrue by The Sunday Times, the newspaper which most prominently reported it. The reputation of the IPCC, it seemed, had been triumphantly vindicated. The growing tide of scepticism over climate change had at last been reversed. But this episode leaves many questions unanswered.
The “correction”, gleefully quoted by everyone from the WWF and The New York Times to The Guardian’s George Monbiot related to what was known as “Amazongate”. This was one of the series of controversies which exploded round the IPCC last winter, when it was shown that many of the high-profile claims made in its 2007 report had been based on material produced by environmental activists and campaigning groups rather than on proper, peer-reviewed scientific evidence.
2008 was the year man-made global warming was disprovedOne example, also reported in The Sunday Telegraph, was the IPCC’s much-publicised claim that climate change, leading to a reduction in rainfall, was threatening the survival of “up to 40 per cent” of the Amazon rainforest. The only source the IPCC could cite for this in its report was a document from the environmental advocacy group WWF. But last week The Sunday Times, in its prominent “correction” to its own story, conceded that the IPCC’s claim was “supported by peer-reviewed scientific evidence” after all. Not identified, however, was the nature of this peer-reviewed evidence. Where is it?
The story of “Amazon-gate” has unfolded through three stages. Step one was the passage in the IPCC report almost identical to one made in a non-peer-reviewed WWF paper of 2000 on forest fires in the Amazon. Specifically the IPCC stated that “up to 40 per cent of the Amazonian forests could react drastically to only a slight reduction in precipitation”. But the only source the WWF in turn had been able to cite to support this was a paper published in Nature in 1999, from a team led by Dr Daniel Nepstad, formerly employed by the WWF but now the “senior scientist” with another advocacy group closely linked to the WWF, the Woods Hole Research Center. Certainly Nepstad’s paper was peer-reviewed: however its subject was not climate change but the impact on the Amazon rainforest of “logging and fire”. It found that “logging companies in Amazonia kill or damage 10-40 per cent of the living biomass of forests”. This had nothing whatever to do with global warming but was cited as the origin of that “up to 40 per cent” figure later used by the WWF and the IPCC.
Step two, when all this was reported last January, was a disclaimer from the WWF, emphasising that its 2000 report did “not say that 40 per cent of the Amazon forest is at risk from climate change”. But it went on to say that the real source for its 2000 paper (which had been “mistakenly omitted") was another paper, “Fire in the Amazon”. This was also written by Dr Nepstad, as head of yet another advocacy group linked to Woods Hole, the Amazon Environmental Research Institute. Although it was now being suggested that this paper should have been cited as the original source for the IPCC’s claim, it too was not peer-reviewed. Thus, twice over, the IPCC’s claim appears to rest both on non-peer-reviewed science and on studies not related to global warming at all.
So great was the IPCC’s embarrassment over these revelations that the story moved to a third stage. Various scientists, led by Dr Nepstad, suggested further studies which might justify the claim. But an exhaustive trawl through all the scientific literature on this subject by my colleague Dr Richard North (who was responsible for uncovering “Amazongate” in the first place), has been unable to find a single study which confirms the specific claim made by the IPCC’s 2007 report. If one exists we would very much like to see it.
There are several studies based on computer models which attempt to estimate the possible impact of climate change on the Amazon rainforest, but none of these have so far supported that 40 per cent figure. Other researchers in turn have been highly critical of these models, suggesting that they are too crude to replicate the complex workings of the Amazonian climate system and that all observed evidence indicates that the forest is much more resilient to climate fluctuations than the alarmists would have us believe.
Nothing did more to excite attention over the effect of climate change on the rainforest than the exceptional drought of 2005, just when the IPCC’s 2007 report was being compiled. Since then, however, abnormally heavy rainfall in the region has brought disastrous floods to Brazil, both last year and again last week.
In other words there is a real mystery here. Nothing so far made public seems to justify an assertion that the IPCC’s specific claim is “supported by peer-reviewed scientific evidence”. In view of all the controversy this issue has aroused over several months, it might seem odd that, if such evidence exists, it hasn’t been produced before. Is it not now a matter of considerable public interest that we should be told what it is? See story here.
Another fine piece can be found here.
Research (below, enlarged here) shows the Amazon has benefited from increased CO2 even as deforestation took place (source CO2 Science).

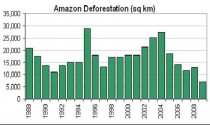
Deforestation of the Amazon has been decreasing (below, enlarged here) .
Though the animal kingdom is being affected (below, enlarged here).

See also Amazongate, the Smoking Gun here.
Jun 27, 2010
BP, Greenpeace and the Big Oil Jackpot
By Jeff Blue (Dennis Quaid), Undercover Blues
In what passes for debate about climate change one of the most tiresome allegations is that skeptics are lavishly funded by big oil. As a result of this funding, so the argument goes, the public has been confused by those who’ll say anything in exchange for a paycheck.
“Follow the money” we’re told and you’ll discover that climate skeptics are irredeemably tainted. Ergo nothing they say can be trusted. Ergo their concerns, questions, and objections should be dismissed out of hand.
It’s therefore amusing that the current oil spill in the Gulf of Mexico is now drawing attention to the close relationship between climate change activists and BP - aka British Petroleum, an entity for which the descriptor “big oil” was surely invented.
According to the Washington Post the green group Nature Conservancy - which encourages ordinary citizens to personally pledge to fight climate change - “has accepted nearly $10 million in cash and land contributions from BP and affiliated corporations over the years.”
Gee, didn’t Greenpeace build an entire ExxonSecrets website to expose the allegedly diabolical fact that, over a 9-year-period (1998-2006) ExxonMobil donated a grand total of $2.2 million to a conservative think tank?
$10 million versus $2 million. Who do we suppose has the cozier relationship with big oil?
But that’s just the beginning. The Washington Post also points out that Conservation International, another green group which insists climate change represents a “profound threat,” has “accepted $2 million in donations from BP over the years and partnered with the company on a number of projects.”
Funny, Greenpeace doesn’t talk about that. Nor does it mention:
- that BP is funding research into “ways of tackling the world’s climate problem” at Princeton University to the tune of $2 million per year for 15 years
- that BP is funding an energy research institute involving two other US universities to the tune of $500 million - the aim of which is “to develop new sources of energy and reduce the impact of energy consumption on the environment”
- that ExxonMobil itself has donated $100 million to Stanford university so that researchers there can find “ways to meet growing energy needs without worsening global warming”
- The only dollar amounts Greenpeace cites in its explanation of why it decided to launch ExxonSecrets is that measly $2.2 million. Versus 10 + 2 + 30 + 500 + 100. Let’s see, which all adds up to...wait for it...$642 million.
If the world is divided into two factions - one that believes climate change is a serious problem and another that thinks human influence on the climate is so minimal it’s indistinguishable from background noise - one group has pulled off a bank heist while the other has been panhandling in front of the liquor store.
In the same document in which Greenpeace talks about the ExxonMobil money it chillingly asserts that climate “deniers” aren’t entitled to free speech. Why? Because “Freedom of speech does not apply to misinformation and propaganda.”
Actually, the big thinkers on the subject have consistently taken the opposite view. John Stuart Mill was adamant that no one has the right to decide what is or is not propaganda on everyone else’s behalf. He would have looked Greenpeace in the eye and told it to stop imagining that its own judgment is infallible.
More than a hundred years later Noam Chomsky famously declared that if you don’t believe in freedom of expression for opinions you despise you don’t believe in it at all.
If Greenpeace would like to have a serious conversation about who, exactly, is spreading misinformation I’m up for that - since it’s overwhelming obvious that the big oil jackpot was awarded to those on the Greenpeace side of the debate.
The fact that climate change activists have enjoyed such a powerful funding advantage and yet insisted all the while that the exact opposite was the case is troubling. It tells us a good deal about their intellectual rigour. About their character. And about their ability to distinguish fact from fiction.
If there really is a climate crisis, if our grandchildren’s future really is imperiled, these aren’t the people to lead us out of the wilderness.
Jeff Blue (Dennis Quaid), Undercover Blues
UPDATE (June 6): Reader Terry Kesteloot alerted me to the fact that the Greenpeace.org website is apparently infected with a “very low” risk computer virus. The links in this post to Greenpeace’s ExxonSecrets FAQ have therefore been replaced with links to a copy of the document that resides at Archive.org (scroll down once the page loads). If your machine has virus protection, the document may be viewed directly on the Greenpeace website.
ICECAP note: BP also granted $500,000 to the University of California Berkeley to study energy and the environment. That may be included in the above mention of grants to two universities. We should note BP donated nearly $1 million to the Obama Presidential campaign and was a finalist in a ‘safety award’ about to be given by the Obama administration to an oil company. Read about any of these in the old lamestream media?
Jun 26, 2010
Ice Dancing
By Steven Goddard, Guest Post on WUWT

In order to better visualize what is happening in the Arctic this summer, I generated an animation of satellite photos over the area of open water west of Barrow, AK. It reveals a very dynamic ice edge - with the ice moving as it is blown around by winds associated with the Beaufort Gyre.
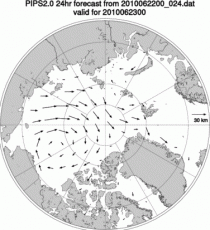
The region of ice in the video is shown in blue below (enlarged here).
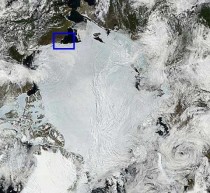
Here is what I see.
* The ice edge is moving left to right about 10 miles per day.
* Ice is being torn off the main ice sheet north of Barrow.
* A large chunk of ice in the center of the open water (on June 18) moves northwest, crashes into the main mass of ice, and disintegrates.
* Little evidence of melting.
* The landfast ice is not showing any changes.
* Lakes are still frozen solid.
What do you see? See post and comments here.
Jun 26, 2010
Climate Change Delayers Topple Rudd
Tom Arup
Julia Gillard has made no concrete commitment on when to put a price on carbon emissions, despite former Prime Minister Kevin Rudd urging his party to try passing an emissions trading scheme after the election.
Speaking after she had toppled Mr Rudd yesterday, Ms Gillard said she would now work to build a public consensus for a carbon price ‘’as vigorously as I can and as long as I need to.’’
‘’I will do this because I believe in climate change,’’ she said, ‘’I believe human beings contribute to climate change.’’
In April, the government delayed its emissions trading scheme until at least 2013, sparking a massive collapse in public support for Labor and Mr Rudd in opinion polls.
In his final statement as Prime Minister yesterday, Mr Rudd said he was proud of the fact the government tried three time to pass an emissions trading scheme, ‘’although we failed.’’
‘’And, if I had one point of future policy, it must be our ambition to pass a carbon pollution reduction scheme within this parliament, the one that follows, I mean, so that we can make a difference, a real difference, to climate change,’’ Mr Rudd said.
His comments are being interpreted as a parting shot at the ALP’s New South Wales right-wing faction, led by Senator Mark Arbib, who pushed for the government to dump the emissions trading scheme.
Senator Arbib and the NSW Right were also instrumental in bringing down Mr Rudd’s leadership.
A final decision to shelve the emissions trading scheme until 2013 was made in April by a cabinet subcommittee made up of Mr Rudd, Ms Gillard, Treasurer Wayne Swan and outgoing Finance Minister Lindsay Tanner.
Ms Gillard and Mr Swan - now Deputy Prime Minister - both actively campaigned within the government to defer the emissions trading scheme.
Ms Gillard said yesterday she did not want to ‘’in any way seek to diminish my role in making that decision’’.
‘’I came to that decision because I fundamentally believe that if you are going to restructure our economy so that we can deal with a carbon price and deal with all of the transformations in our economy that requires, then you need community consensus.’’
Story here. Another is here. See Andrew Bolt destroy the know nothing alarmist Flannery in this interview here.
Jun 24, 2010
23 Jun - Heavy snow for Europe’s glaciers plus more Southern Hemisphere resorts open
If You Ski
* Up to 30cm (a foot) of new snow so far today around Queenstown’s ski areas.
* Up to 50cm (20 inches) of fresh snow in the Alps.
* Second Californian ski area to open in July.
* Cairngorm in Scotland wraps up seven month season.
* Argentina’s resort start to open and more snow in Chile and South Africa.
Ski Info reports that more of Europe’s glacier ski areas are opening and that they, along with the centres already open, are benefitting from heavy snowfalls in recent days.
More ski areas have also been opening in the southern hemisphere, where resorts in New Zealand are reporting up to 25cm of new snow so far today. In addition a third US area has announced plans to open its slopes in July.
There have been low temperatures and heavy snow on glaciers in the Alps in the past few days. With all three summer ski areas now open in France, this means 10 areas are offering powder snow conditions on their slopes at the moment! In Austria the Hintertux glacier has reported 45cm (18 inches) of new snow it has a 590m vertical with 20km of pistes open, and a 195.cm (6.5 foot) base. The Dachstein glacier has a210cm (7 foot) base and is reporting powder conditions. It’s beginner park and super park are both open. The Kitzsteinhorn glacier above Kaprun has also reopened, reporting another 5cm (two inches) of fresh snow on Tuesday, on top of weekend falls and a full 750 metres of skiable vertical. The Molltal glacier will re-open this Sunday, 27 June at 8am with about 9 km of groomed slopes open daily to 4pm through to the end of August. The centre currently reports up to 3.6m (12 foot) snow depths on the glacier.
Italy will also be up to four summer ski areas open by the weekend when Cervinia re-opens with fresh snow. It will join the still-open Presena glacier above Passo Tonale where just two advanced to expert runs are open, as well as Passo Stelvio and Val Senales, which has reported 20cm of new snow in two falls over the past few days. In Switzerland it’s still only Zermatt, Europe’s highest ski area, which has 8km of runs open.
In France the ski lifts began running again at the weekend at Tignes on the Grande Motte glacier and in neighbouring Val d’Isere which joined Les 2 Alpes which re-opened a week ago. In Tignes there’s 20km of piste and a giant terrain park open, the snow base is 120cm (four feet) and there’s been another 5cm of fresh snow. The slopes are open from 7:15am to 1pm, and located at an altitude ranging from 3,000 to 3,456 metres. The glacier features 12 ski lifts and can be accessed in seven minutes by the underground funicular. Les 2 Alpes has 80cm (2.6 feet) of snow at 2600m and 2.8m (over 9 feet) up at 3200m with 12 slopes and the terrain park open at one of Europe’s largest summer ski areas.
The only other places to ski in Europe are in Norway, where three glacier ski areas are open at Folgefonn with up to four metres of snow lying, Galdhoppigen with up to five metres of snow lying and Stryn with up to 4.5 metres of snow lying.
In Scotland more than 60 skiers took to the slopes at CairnGorm Mountain on the summer solstice on Monday 21st June 2010 to enjoy some midsummer skiing on the snow still lying there in the Ptarmigan bowl. They were able to take advantage of the two rope tows which had been set up there by the resort’s operators CairnGorm Mountain Ltd. Skiers had travelled from as far away as the Isle of Mull in order to be able to say that they had skied at midsummer at CairnGorm. The 21st was the 147th day of skiing at CairnGorm since the season started on 28 November 2009 and brings to 145,007 the total number of skier days at the resort in what by any account has been an extraordinary season. There were 23 days when skiing was not possible due to high winds or access blocked by snow. Last year 65,000 skiers visited the resort and only three years ago they had their worst season ever with only 38,000 skiers.
In North America the ski season ended a weekend later than expected in Utah when Snowbird decided to open last weekend after all, extending their 2009/10 season to 189 total days. Customers were limited to one ride up the Aerial Tram per day, allowing access to Little Cloud lift and skiing on Regulator Johnson. All additional terrain was closed and classified as “backcountry terrain.”
However Timberline on Mt Hood in Oregon and Mammoth Mountain in California are still operating their ski lifts and snow slopes.
Mammoth, which currently has 2-6 feet (60-180cm) of snow has previously said they’ll stay open for two more weekends to July 4. However another California resort, Boreal, has now said they’ll open for one weekend only, on the 10th/11th July. Lifts will be open from 10am - 2pm, to enjoy the abundance of snow left from the snowy spring. A full terrain park will be built, accessed via the Castle Peak Quad and lift tickets will cost 20 dollars. North of the border Whistler’s summer skiing and boarding area on the Blackcomb glacier is now open and the resort is also offering summer snowshoeing and tubing.
In South America Las Lenas is the first resort to open in Argentina has opened with a metre of snow on upper slopes, but the country’s other leading resort, Catedral, says it needs more snow before opening, there’s currently about a foot (30cm) on upper slopes. Conditions at most ski areas in Chile are looking good after the centres there reported receiving up to two feet (60cm) of snow in the past week, most of it just before the weekend. Chapa Verde has a 60cm (two foot) base and Chapelco 50cm (20 inches).
However Valle Nevado and the South American ‘ three Valleys’ that surround it have some of the best conditions on the continent with more than 1.6m (over five feet) of accumulated snowfall to date. Portillo, which delayed its opening by a week, is now on schedule to open this weekend.
In southern Africa there’s snow sports as well as World Cup football. Africa’s Tiffindell is open for skiing and Afriski in Lesotho has had more new snow taking its base depth to 65cm (2.2 feet) with a 400m long slope open.
In Australia there’s been no new natural snowfall for over a week now but temperatures are continuing to stay quite low so most resorts with snowmaking are making more, and resorts like Falls Creek, Mt Hotham and Perisher have 40 or 50cm (16-20 inches) of snow on snowmaking areas, Thredbo has a little less.
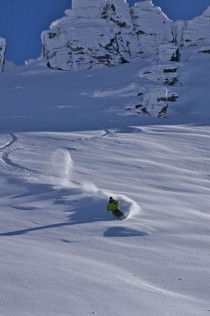
More ski areas have been opening in New Zealand. Treble Cone, which has received excellent pre-season snow, will open tomorrow (Thursday 24 June) with the first lift running at 8.30am. There’ll be Amisfield bubbles for the first 150 skiers on the lifts. Whakapapa is scheduled to open on Saturday 26th June.
Of the already-open areas, Turoa has 80cm (nearly three feet) of snow on upper slopes. The Remarkables has 85cm (nearly three feet) and has reported 10cm (four inches) of new snow earlier today. Coronet Peak has the same amount lying and 15cm (six inches) of new snow so far today. But Mt Hutt has trumped both with 25cm (10 inches) of new snow today and a metre (3.3 foot) base.
After getting their first turns of the season on Treble Cone’s feeride terrain, skiers and snowboarders can spend the afternoon testing their aerial skills on The AirBag. The AirBag is a supersized, air-filled stunt cushion that provides a soft landing for skiers and snowboarders. The first time it has been seen in on-snow in New Zealand, The Airbag is used throughout Europe to develop the training techniques of Olympic and national aerial teams.
The giant 10mx15m cushion will be in full view of the Treble Cone deck and high-speed six seater chairlift for onlookers to check out all the aerial action as some of the region’s top pro freeskiers and snowboarders put it through its paces. See post here. (Thanks for tip from Roger Pielke Sr.)
|


